Solar generation guide
How Location, Direction and Angle Affect Plug-in Solar Generation
This guide explains how plug-in solar generation varies across the UK, how panel direction and angle affect output, and why the best setup is not just the one that generates the most electricity, but the one that helps your home use more of it.
Two homes can buy the same plug-in solar kit and get very different results.
Part of that comes down to location. A home in a sunnier part of the UK will usually have more solar potential than one in a cloudier or more northern area. But location is only part of the story.
Two next-door neighbours could also see very different output from the same type of kit. One might have panels facing south in a clear, sunny spot. The other might have panels facing the wrong way, sitting too flat, or shaded by a fence, tree or nearby building for much of the day.
Where you live matters, but how you set up your panels usually matters more.
That is because plug-in solar depends on more than the kit itself. The direction your panels face, the angle they sit at, and the amount of shade they get during the day can all make a real difference to how much electricity they generate and how much you can save.
The good news is that you do not need a perfect setup for plug-in solar to be worthwhile. A few sensible choices about placement can help your panels catch more sunlight, generate more usable electricity and improve the savings you get from the system.
If you are new to plug-in solar, you may also want to start with our complete guide to plug-in solar panels in the UK.
In this article
Key takeaways
Plug-in solar generation is shaped by several factors working together. The most important lessons from this guide are:
- Location sets the baseline. Southern parts of the UK usually have higher solar potential than northern areas, but a well-positioned kit in a lower-yield area can still produce useful electricity.
- Panel direction usually makes the biggest setup difference. South-facing panels normally produce the highest annual generation, east and west-facing panels generate more electricity at different times of day, and north-facing panels are usually the weakest option.
- Panel angle affects annual output. In the UK, a tilt of around 30 to 40 degrees is a good practical target, with 35 degrees close to the middle of that range.
- Vertical panels can still be practical. Balcony and wall-mounted panels usually generate less than tilted panels, but they may be the most realistic option for some homes.
- Completely flat panels are best avoided. Flat panels can generate electricity, but dirt, debris and rainwater can collect on the surface, and some manufacturers require a minimum tilt for warranty cover.
- Shade and maintenance matter. Trees, fences, buildings, dirt, frost, poor airflow and panel ageing can all reduce real-world output.
- The best setup is practical as well as productive. Aim for a sunny, safe, secure position that faces a good direction, uses a sensible angle and avoids regular shade.
How much does UK location affect plug-in solar generation?
Where you live in the UK does affect how much electricity a plug-in solar kit can generate. The general pattern is simple: southern parts of the UK tend to have higher solar potential than northern areas. South coast locations, parts of south west England and other sunnier southern regions usually see stronger annual solar generation, while Scotland and other northern areas tend to produce less over the year.
There are a few reasons for this. Southern parts of the UK are closer to the equator, so the sun is generally higher in the sky. Northern areas also tend to have cloudier weather and slightly shorter winter days. Over a full year, those differences can have a meaningful effect on solar generation.
To show the difference, we can compare two large coastal cities in very different parts of the UK: Brighton on the south coast of England, which is one of the stronger-yield examples in our table, and Aberdeen in north east Scotland. Using the same 800W south-facing plug-in solar setup angled at 35 degrees, our calculator estimates annual generation of around 909 kWh in Brighton, compared with around 702 kWh in Aberdeen.
That means the Brighton setup generates about 29% more electricity over the year from the same kit. Put another way, UK location can make a noticeable difference even before you consider direction, angle or shading.
But this should not put northern households off. A well-placed kit in Scotland or northern England can still generate a useful amount of electricity over the year. In this example, Aberdeen still produces around 702 kWh a year. The total may be lower than in sunnier parts of the UK, but it can still reduce how much electricity you buy from the grid and lead to genuine bill savings.
Estimated annual plug-in solar generation by UK area
The table below shows the same 800W plug-in solar setup modelled across a selection of UK areas. It is not meant to rank every postcode in the country, but it gives a useful sense of how annual generation changes by location.
| UK area | Example locationLocation | Annual yieldkWh/year |
|---|---|---|
| South East England | Brighton | 909 kWh |
| South West England | Plymouth | 839 kWh |
| East of England | Norwich | 820 kWh |
| London | London | 811 kWh |
| Wales | Cardiff | 794 kWh |
| Midlands | Birmingham | 767 kWh |
| North East England | Newcastle | 758 kWh |
| Yorkshire and the Humber | Leeds | 750 kWh |
| North West England | Manchester | 706 kWh |
| Scotland | Aberdeen | 702 kWh |
| Northern Ireland | Belfast | 688 kWh |
Notes on data
Figures are from our calculator for an 800W plug-in solar setup with panels facing south at a 35 degree angle. The calculator uses PVGIS solar generation data for each postcode area with a 15% deduction applied to keep estimates conservative. These are representative postcode-area examples, not a precise ranking of every UK location, and actual output will vary with exact postcode, shading, panel type, mounting position and local conditions.
So, what is a typical annual output for an 800W plug-in solar kit in the UK? Across the 124 UK postcode areas in our calculator, an 800W south-facing plug-in solar setup generates around 794 kWh a year at the median, with an average of around 779 kWh a year.
Using the Ofgem electricity price-cap rate of 26.11p/kWh that applied when this calculation was produced, that amount of electricity would be worth roughly £203 to £207 a year. Actual bill savings depend on how much of that electricity the household uses.
In simple terms, a well-positioned 800W plug-in solar kit in the UK will often generate somewhere around 760 to 800 kWh a year.
How much electricity could an 800W plug-in solar kit generate in your area?
The table above shows broad regional examples, but plug-in solar generation can still vary by postcode area. Use the lookup below to estimate annual solar yield for a typical 800W south-facing plug-in solar setup where you live, and see how your area compares with the rest of the UK.
Check plug-in solar generation by postcode
Enter a UK postcode to estimate annual electricity generation for an 800W south-facing plug-in solar kit.
Where you live helps set the baseline for how much solar energy is available, but it does not decide everything. A well-positioned kit in a lower-yield area can still outperform a poorly positioned kit in a sunnier one. The next thing to look at is panel orientation, because the direction your panels face can make a major difference to how much electricity they generate.
How panel direction affects plug-in solar generation
Of the three main setup factors covered in this guide (location, panel direction and panel angle), panel direction usually makes the biggest difference to generation. Location sets the baseline, and angle matters too, but the direction your panels face has a major effect on how much sunlight they receive during the day.
In the UK, a south-facing panel will usually generate the most electricity over the course of a year, assuming the panels are fixed in place and not significantly shaded. That is because it receives the strongest and most direct sunlight around the middle of the day, when the sun is highest in the sky.
East and west-facing panels can still work well, but they shift generation into different parts of the day. East-facing panels tend to produce more in the morning, while west-facing panels tend to produce more in the afternoon and early evening.
North-facing panels are usually weaker in the UK because they receive less direct sunlight, especially outside the summer months.
South, east, west and north-facing panels compared
The table below compares the same 800W plug-in solar setup across different UK locations, with only the panel direction changed.
| Example locationLocation | South facing yieldS | East facing yieldE | West facing yieldW | North facing yieldN |
|---|---|---|---|---|
| Brighton | 909 kWh | 693 kWh | 717 kWh | 458 kWh |
| Plymouth | 839 kWh | 669 kWh | 675 kWh | 458 kWh |
| Norwich | 820 kWh | 649 kWh | 633 kWh | 427 kWh |
| London | 811 kWh | 648 kWh | 628 kWh | 431 kWh |
| Cardiff | 794 kWh | 626 kWh | 638 kWh | 433 kWh |
| Birmingham | 767 kWh | 614 kWh | 600 kWh | 416 kWh |
| Newcastle | 758 kWh | 591 kWh | 585 kWh | 393 kWh |
| Leeds | 750 kWh | 596 kWh | 584 kWh | 399 kWh |
| Manchester | 706 kWh | 571 kWh | 560 kWh | 395 kWh |
| Aberdeen | 702 kWh | 545 kWh | 541 kWh | 363 kWh |
| Belfast | 688 kWh | 550 kWh | 542 kWh | 377 kWh |
Notes on data
Figures are from our calculator for an 800W plug-in solar setup at a 35 degree angle. The calculator uses PVGIS solar generation data for each postcode area with a 15% deduction applied to keep estimates conservative. These are representative postcode-area examples, and actual output will vary with exact postcode, shading, panel type, mounting position and local conditions.
Across all 124 UK postcode areas tracked in our calculator, the same broad pattern appears when comparing south, west, east and north-facing panels:
- South-facing panels produce the highest total annual generation and usually reach their strongest output around the middle of the day, between 11am and 1pm.
- West-facing panels produce around 21% less electricity per year than south-facing panels on average, but they usually generate more electricity later in the day, with a typical peak window of 1pm to 3pm.
- East-facing panels also produce around 21% less electricity per year than south-facing panels on average, but they usually generate more electricity earlier in the day, with a typical peak window of 9am to 11am.
- North-facing panels are normally the weakest option in the UK, producing around 46% less electricity per year than south-facing panels on average, with a typical peak window of 11am to 1pm.
The overall pattern is similar across the UK, but the exact yield for each direction still changes from place to place. Use the interactive figure below to see how much electricity an 800W plug-in solar kit could generate in your postcode area when facing different directions.
Compare plug-in solar output by panel direction
Enter a UK postcode, then choose a compass direction to see how an 800W plug-in solar kit could perform in your area.
Cardiff, CF postcode area
South-facing panelsClick a direction to show yield
Table of results for Cardiff
| Panel direction | Annual Output | % of potential yield |
|---|---|---|
| South | 794 kWh | 100% |
| South west | 755 kWh | 95% |
| South east | 744 kWh | 94% |
| West | 638 kWh | 80% |
| East | 626 kWh | 79% |
| North west | 502 kWh | 63% |
| North east | 493 kWh | 62% |
| North | 433 kWh | 55% |
Notes on data
Estimates assume an 800W kit at 35 degrees. Figures use PVGIS solar generation data for each postcode area with a 15% deduction to keep the result conservative. Actual output varies with shading, panel type and mounting position.
South-facing panels are best, but what if south is not an option?
Not every home has a perfect south-facing spot for plug-in solar panels. You may be limited by the direction of a balcony, the shape of a garden, the position of a shed roof, or where an outdoor socket is available.
That does not automatically rule plug-in solar out. South-facing panels usually generate the most electricity overall, but the best setup is not only about the highest annual output. It also depends on how much of that electricity your home can use as it is generated.
East and west-facing panels can still be useful if their output lines up with your household routine. An east-facing setup may suit homes with more morning electricity use, while a west-facing setup may be useful later in the day.
North-facing panels are usually weaker, but they may still be worth considering if your options are limited and the electricity they generate is likely to be used in the home.
If your placement options are limited, use the direction comparison above as a starting point. It can help you compare the generation available from each direction with when your home is most likely to use electricity. For a fuller estimate that includes usage and potential bill savings, try our plug-in solar calculator.
Can two plug-in solar panels face different directions?
An 800W plug-in solar setup will typically use two 400W panels. Those panels do not always need to face the same way. One panel could face east and another west, provided the microinverter supports panels with different orientations.
Look for terms such as multiple MPPT channels, independent MPPT inputs or dual MPPT in the product specification. In simple terms, this means the microinverter is designed to handle panels facing in different directions. If the microinverter only has a single MPPT channel, both panels must face the same direction.
An east-west split setup will usually generate less electricity over the year than two panels facing south, but it can spread generation more evenly through the day, with more electricity available in the morning and late afternoon rather than one stronger peak around midday.
How panel angle affects plug-in solar generation
So far, we have looked at location, and seen how areas in the south of the UK tend to have more solar potential than northern areas. We have also looked at panel direction, and why a south-facing setup usually gives the best annual yield. But there is one more setup factor that can make a meaningful difference to plug-in solar generation: the angle you position your panels.
What do we mean by panel angle?
Panel angle refers to the tilt of the panels, rather than the direction they face.
For example, one home might have panels mounted vertically against a wall or on a balcony railing, while another might use a tilted garden frame or a low shed roof. The panels may face the same direction, but the sunlight will hit them differently because the angle is different.
For plug-in solar, panel angle matters for two main reasons. First, it affects how directly sunlight reaches the panel during the day. Second, it affects how easily rainwater, dirt and debris can run off the surface.
In this guide, we focus on three common angles: vertical panels at 90 degrees, tilted panels at 35 degrees, and flat / low-angle panels at 5 degrees. These cover many of the setups people are likely to consider for plug-in solar, from balcony railings and walls to garden frames, sheds and flat roofs.
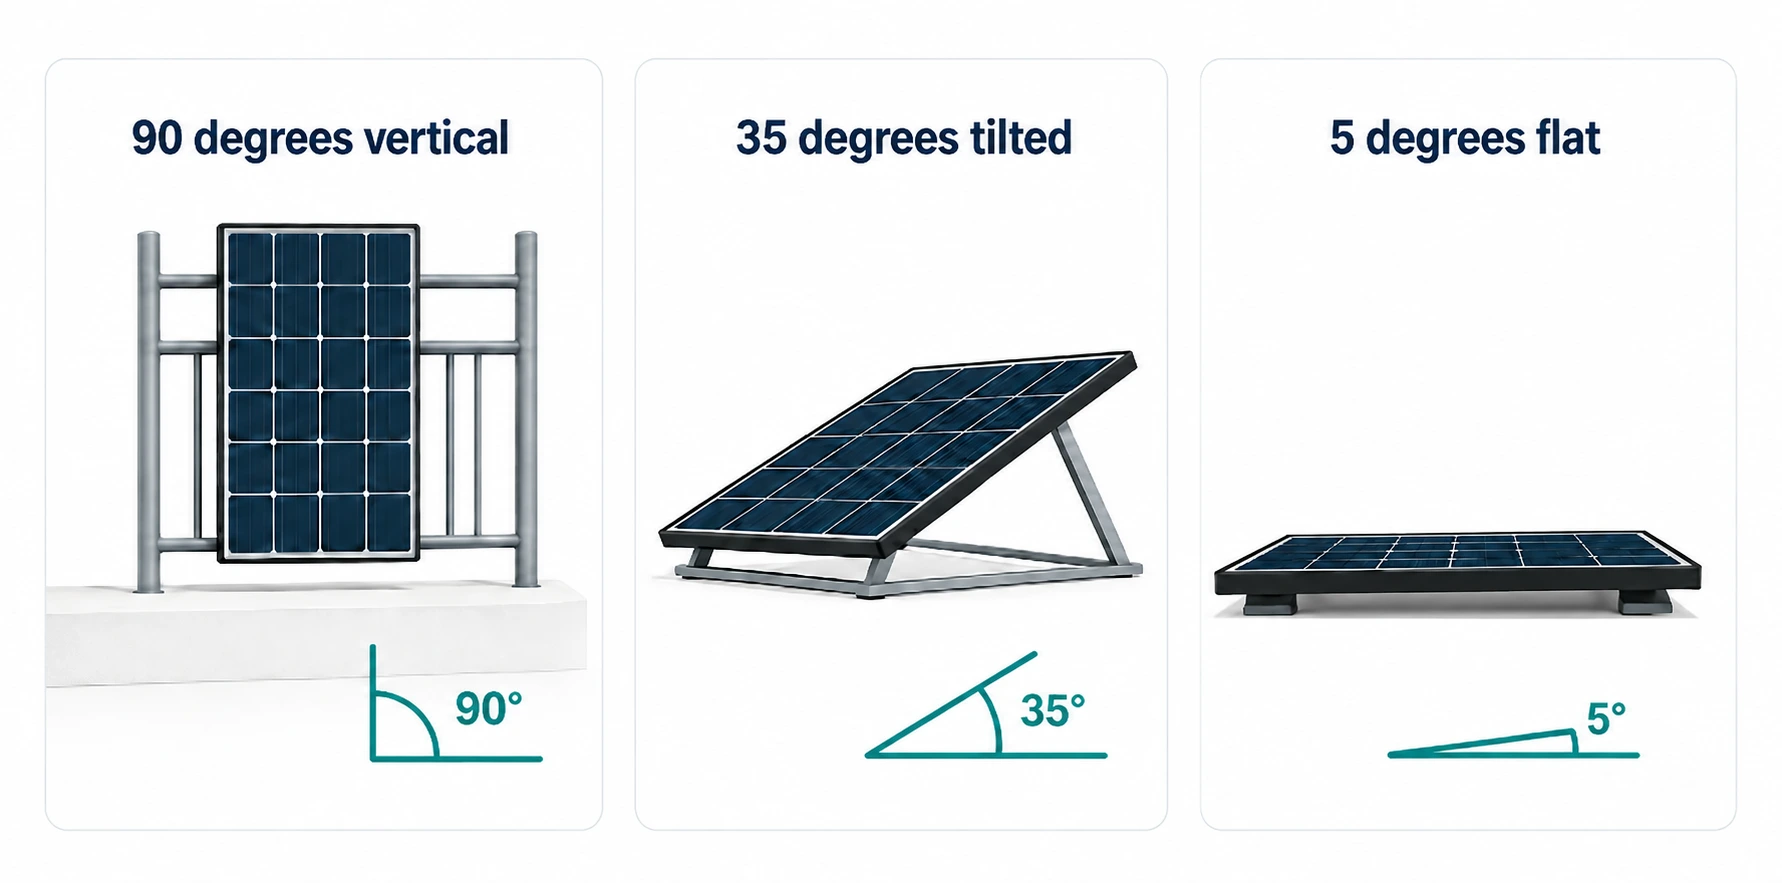
Annual generation by panel angle and UK area
The table below compares the same 800W south-facing plug-in solar setup across different UK locations, with only the panel angle changed. The flat option is modelled as a 5-degree low-angle setup, because completely flat 0-degree panels are not recommended due to poor rain water runoff.
| Example locationLocation | Vertical panels, 90 degrees90° | Tilted panels, 35 degrees35° | Flat / low-angle panels, 5 degrees5° |
|---|---|---|---|
| Brighton | 646 kWh | 909 kWh | 790 kWh |
| Plymouth | 597 kWh | 840 kWh | 740 kWh |
| Norwich | 604 kWh | 819 kWh | 705 kWh |
| London | 589 kWh | 809 kWh | 704 kWh |
| Cardiff | 567 kWh | 793 kWh | 699 kWh |
| Birmingham | 561 kWh | 765 kWh | 666 kWh |
| Newcastle | 572 kWh | 759 kWh | 647 kWh |
| Leeds | 557 kWh | 749 kWh | 647 kWh |
| Manchester | 517 kWh | 707 kWh | 619 kWh |
| Aberdeen | 534 kWh | 701 kWh | 597 kWh |
| Belfast | 506 kWh | 688 kWh | 600 kWh |
Notes on data
Figures are from our calculator for an 800W plug-in solar setup facing south. The calculator uses PVGIS solar generation data for each postcode area with a 15% deduction applied to keep estimates conservative. These are representative postcode-area examples, and actual output will vary with exact postcode, shading, panel type, mounting position and local conditions.
Tilted panels at 35 degrees give the highest annual generation in these examples. In the UK, an angle somewhere around 30 to 40 degrees is often considered close to optimum for annual solar generation. That is why a tilted garden frame, shed roof or angled roof mounting position is often a strong option for plug-in solar, provided the panels can face a good direction and avoid shading.
Vertical panels at 90 degrees usually generate less electricity over the year, but they can still be practical for balcony railings, walls and other upright mounting positions. Some balcony and wall mounting kits allow the panels to be set at a slight angle rather than completely vertical, which can improve generation. However, angled mounts may catch more wind and may not be practical where a panel would project into a walkway, shared space or other high-traffic area.
Flat / low-angle panels at 5 degrees can generate more electricity than vertical panels in the examples above, while avoiding the worst drawbacks of a completely flat 0-degree installation. Totally flat placement should usually be avoided because rainwater, dirt and debris can collect on the panel surface instead of running off, which can reduce performance and make cleaning more important. Some solar panel manufacturers also warn against mounting panels completely flat, and may specify a minimum tilt such as 5 degrees to protect the product warranty.
The table gives a useful comparison across example locations, but the exact figures still depend on where you live. Use the interactive figure below to see how much electricity an 800W south-facing plug-in solar kit could generate in your postcode area when mounted vertically, tilted or flat.
Check plug-in solar generation by panel angle
Enter a UK postcode to compare estimated annual generation for vertical, tilted and flat south-facing plug-in solar panels in your area.
How much should you worry about panel angle?
Panel angle matters, but it is not something most plug-in solar users need to fine-tune degree by degree. In the UK, an angle somewhere around 30 to 40 degrees is a good practical target for annual generation, with 35 degrees sitting close to the middle of that range.
If you are using a garden frame, shed roof or adjustable mounting kit, it is worth aiming for a tilted setup in that range where practical. If you are using a balcony or wall, a vertical setup can still work, and some mounting kits allow a slight tilt, but the installation still needs to be secure, suitable for wind exposure and safe for the space around it.
The main thing is to avoid clearly poor placement choices. A completely flat panel may look neat and can still generate electricity, but it is usually better to introduce at least a small tilt so rainwater and dirt can run off. In practice, the best setup is usually one that avoids shade, faces a good direction, uses a sensible angle and can be mounted safely.
Other factors that affect plug-in solar generation
Location, direction and angle do most of the work when estimating plug-in solar generation, but they are not the only things that affect real-world output.
Once the panels are installed, day-to-day conditions can also make a difference. Shade, excessive heat, dirt and gradual panel ageing can all affect how much electricity a kit produces over time.
Shading from trees, fences and nearby buildings
Shading is one of the biggest real-world factors to watch for. Even if a panel faces a good direction and sits at a sensible angle, output can fall if sunlight is blocked by a tree, fence, wall, balcony rail, shed, roof edge or nearby building.
This matters because plug-in solar panels are often placed in gardens, on balconies, against walls or on shed roofs. These positions can be practical, but they may also be more likely to receive partial shade during the day.
Before choosing a position, check the spot at different times, especially around the middle of the day when solar generation is usually strongest. A place that looks sunny in the morning may be shaded by the afternoon, and a spot that works well in summer may get more shade in winter when the sun is lower in the sky.
Heat and airflow around the panels
One thing that surprises people is that very hot weather can slightly reduce solar panel efficiency. Solar panels need sunlight, but like most solar panels, plug-in solar panels can become a little less efficient as their temperature rises.
In the UK, this is usually a smaller issue than shade, direction or angle. A bright, hot day will still usually be good for solar generation. But if a panel gets very hot, some airflow behind it can help it stay cooler and perform a little better.
This is worth keeping in mind for wall-mounted, balcony-mounted or shed-mounted setups. A panel with some space behind it will usually stay cooler than one pressed tightly against a hot surface with very little ventilation.
The safest and most suitable mounting position will always depend on the kit, the mounting system and the manufacturer's instructions, but good ventilation is helpful where it can be achieved safely.
Panel age and efficiency loss over time
Solar panels do not usually stop working suddenly after a few years. Instead, their output tends to reduce gradually over their 25-30 year lifespan.
As a broad rule, many modern solar panels lose around 0.3% to 0.5% of their year-one output each year, broadly in line with findings from the NREL PV Lifetime Project 2025 Annual Report, although the exact rate depends on the panel, the manufacturer and the conditions they are used in. For example, if a new 800W setup produced 794 kWh in its first year, a 0.4% annual loss would reduce output by about 3 kWh a year. On that basis, annual generation would be roughly 778 kWh after 5 years, 762 kWh after 10 years and 730 kWh after 20 years.
Panel age is especially worth checking if you are buying second-hand solar panels. An older panel may still work, but it may generate less electricity than it did when new, and it may no longer have the same warranty protection. If you are considering a used panel, check its age, condition, original power rating, warranty status and whether it is compatible with the rest of the kit.
Our main Plug-in Solar Calculator factors typical panel efficiency loss into its long-term savings estimates, so the payback and lifetime savings figures are not based only on perfect first-year output.
Dirty panels, leaves and bird poo!
Anything that blocks sunlight from reaching the panel can reduce output. That includes dust, pollen, leaves, bird poo and general garden dirt.
Rain will clean panels to some extent, especially when they are mounted at an angle. But plug-in solar panels may sit lower down than rooftop panels, so they can still need the occasional check, particularly if they are close to trees, fences, paths, patios or birds.
As a simple routine, if the panels are easy and safe to reach, a gentle clean every few months may also be worthwhile, especially after autumn leaf fall, heavy pollen or a long dry spell.
Use clean water and a soft sponge or soft cloth, and clean the panels when they are cool, such as in the morning or evening. Avoid pressure washers, abrasive pads, harsh chemicals, scrapers or anything that could scratch the glass or damage the panel. Always follow the manufacturer's cleaning instructions.
Extra-long cable runs
Cable length can have a small effect on output, because a little electricity is lost as power travels through the cable. For normal plug-in solar setups, with cable runs of a few metres to around 10 or 20 metres, this is not something you usually need to worry about.
Cable length only really becomes a concern if the cable run is unusually long, for example many tens of metres from the panels to the socket. If a longer run is needed, it is generally better for the longer run to be on the AC side, after the microinverter, rather than using long DC cables between the panels and the microinverter. Keep the microinverter close to the panels where the kit design allows, and use the cables specified by the manufacturer.
Small factors can add up
Most of these factors are smaller than location, direction and angle, but they can still add up in real homes. A slightly shaded panel that is also dirty, poorly ventilated or mounted too flat may produce noticeably less electricity than the headline estimate suggests.
The practical advice is simple: choose the sunniest safe position available, avoid regular shade, keep the panels reasonably clean, allow rainwater to run off, and follow the manufacturer's installation and maintenance guidance.
You do not need a perfect setup for plug-in solar to be useful, but small placement and maintenance choices can make the difference between a kit that performs well and one that underdelivers.
The practical takeaway
Plug-in solar generation depends on location, but the biggest gains usually come from choosing the best panel direction, angle and placement available to you. A south-facing, well-tilted setup will often produce the most electricity, but east, west and other practical positions can still work if the energy is useful to the home. The aim is not perfection. It is to avoid poor placement, reduce shading where possible and choose a setup that gives your household usable solar generation across the year.
Generation only saves money if you use the electricity
Generating the most solar electricity is not always the same as saving the most money. Plug-in solar electricity is most valuable when your home uses it at the time it is being generated. If your panels produce a lot of power while nobody is home and very little electricity is being used, some of that generation may not translate into useful bill savings. A slightly lower-yield setup that produces more electricity when your household is actually using power can sometimes be more valuable in practice.
For that reason, it is worth thinking about your daily routine as well as your panel position. If your panels generate most strongly in the middle of the day, try to shift suitable electricity use into those brighter hours where possible. Running appliances such as washing machines, dishwashers, dehumidifiers, chargers or other flexible loads during sunny periods can help you use more of your own solar electricity. The aim is not just to maximise annual kWh generation, but to maximise the amount of that generation your home can use.
Estimate plug-in solar generation and savings for your home
Use our main Plug-in Solar Calculator to estimate annual generation, likely bill savings and payback time for a 400W or 800W plug-in solar kit based on your own postcode and setup.
Try the Plug-in Solar CalculatorSources and methodology
Methodology
The generation examples in this guide are produced using our calculator, which uses PVGIS solar generation data by UK postcode area. Figures are modelled for plug-in solar setups using the panel size, direction and angle stated in each section. The wider calculator modelling is explained on our methodology and assumptions page.
To keep the estimates realistic, the calculator applies a 15% deduction to the raw generation figures. This is intended to allow for real-world losses such as imperfect conditions, minor shading, mounting differences, temperature effects and normal system inefficiencies.
Sources
- European Commission PVGIS solar calculator and data for postcode-area solar generation modelling used by the calculator.
- Ofgem electricity price cap unit rates and standing charges for the electricity unit rate used when estimating the value of generated electricity.
- NREL PV Lifetime Project 2025 Annual Report for background on long-term solar panel performance and degradation rates.
- Energy Saving Trust solar panel advice for general UK guidance on solar panel placement, shading, maintenance and using solar electricity at home.
Update history
- 1 October 2026: Clarified that the illustrative electricity value uses the 26.11p/kWh Ofgem price-cap rate that applied when the calculation was produced.
- 24 July 2026: Moved the key takeaways higher in the guide and added a clearer closing summary of the main generation and placement points.
- 13 July 2026: Added almost-flat 5 degree panel setup data and updated the generation comparisons.
- 8 July 2026: Published the generation guide with postcode, direction and angle comparisons.