Savings guide
How Much Can You Save with Plug-in Solar?
This guide explains how much plug-in solar could reduce your electricity bills, why savings vary between households, and how your panel setup, always-on electricity use and daytime routine affect the result.
UK government analysis suggests that a typical 800W plug-in solar setup could save around £70 to £110 a year in suitable circumstances. Our calculator modelling suggests that many well-positioned systems could save more, with annual savings often around £95 to £155.
Annual savings usually come down to three factors: how much electricity the panels generate, the home's baseload, meaning the background electricity already being used by always-on devices, and how much of the remaining spare solar electricity the home can use during the day.
This guide looks at realistic annual savings, payback periods and longer-term returns, before explaining the three savings factors in more detail.
In this article
Key takeaways
- A realistic annual saving is often around £95 to £155. That is our modelled range for south, east or west-facing 800W setups using a modest 100W baseload.
- A £450 kit could break even in roughly 3 to 5 years. The exact payback depends on the kit price and the annual saving you achieve.
- Longer-term savings build after break-even. In our simple £450 kit examples, net savings after kit cost reach around £500 to £1,100 after 10 years.
- Generation sets the ceiling. Postcode, panel direction, angle and shading determine how much solar electricity is available.
- Baseload can use solar automatically. Background demand from fridges, routers and other always-on devices can absorb a useful share of generation without you changing routine.
- Spare solar is most valuable when you use it well. Timers, flexible appliances and avoiding several large loads at once can help turn more generation into bill savings.
- Solar does not need to cover the whole appliance load. Even partial coverage of a kettle, washing machine or dishwasher can reduce grid use.
- Buy carefully and avoid upgrade churn. A well-positioned kit that matches your demand can quietly save money for years, while unnecessary upgrades can push back break-even.
How much could plug-in solar save?
To understand typical plug-in solar savings, we ran 8,928 postcode-level scenarios through our calculator for a typical 800W two-panel plug-in solar kit with 2 x 400W panels. The modelling covered 124 UK postcode areas, three panel angles, upright at 90°, tilted at 35° and almost flat at 5°, and eight panel directions, from south through to north.
We then tested each setup against three household-use patterns: homes that are rarely occupied during weekdays, homes occupied one or two weekdays a week, and homes occupied throughout the working week.
Our calculator's generation estimates are based on European Commission PVGIS solar data, with a conservative 15% deduction to account for real-world system losses. Savings were valued using the Ofgem price-cap electricity rate of 26.11p per kWh, which was the current rate when this modelling was produced, and every scenario included a modest 100W household baseload. This means electricity used by devices that remain on in the background, such as fridge-freezers, routers and standby equipment.
The table below shows our main findings.
| Solar panel position | Average annual saving by daytime routine | |||
|---|---|---|---|---|
| Panel angle | Panel direction | Out most weekdays | Home 1-2 weekdays | Home most weekdays |
| Upright, 90° | East or west | £95 | £97 | £100 |
| Upright, 90° | South | £115 | £125 | £138 |
| Upright, 90° | North | £41 | £41 | £41 |
| Almost flat, 5° | East or west | £104 | £119 | £144 |
| Almost flat, 5° | South | £107 | £122 | £147 |
| Almost flat, 5° | North | £101 | £115 | £139 |
| Tilted, 35° | East or west | £105 | £119 | £142 |
| Tilted, 35° | South | £115 | £129 | £155 |
| Tilted, 35° | North | £86 | £93 | £102 |
Notes on data
These savings figures are rounded modelled averages, not a promise of what any individual home will save. They use an 800W kit modelled as 2 x 400W panels, the 26.11p/kWh Ofgem electricity price-cap rate that applied when the modelling was produced, and average results across all 124 UK postcode areas in the calculator.
In the table, 90° means upright, such as a balcony or wall-mounted panel. 5° means almost flat. 35° means a more typical tilted panel angle. Rows that say "east or west" average the east-facing and west-facing results.
Every scenario includes a fixed 100W always-on baseload. In this savings model, that baseload is only counted during estimated solar generation hours, because plug-in solar can only reduce grid imports while the panels are producing electricity.
"Out most weekdays" is a deliberately conservative baseload-only scenario. It assumes the home uses its 100W background load during solar generation hours, with no extra deliberate daytime appliance use. This is slightly more cautious than our calculator's normal "rarely home" setting, which includes a small allowance for occasional daytime use. "Home 1-2 weekdays" adds a small amount of flexible daytime use for someone at home around one to two weekdays each week. "Home most weekdays" adds more flexible daytime use for someone at home around five weekdays each week.
North-facing rows are included for comparison, but they are not part of the main £95 to £155 headline range because north-facing panels are usually a weaker choice for plug-in solar.
The savings shown only count solar electricity used in the home. Surplus electricity is not given a financial value in this model.
Typical plug-in solar savings by home and panel setup
UK savings for south, east and west-facing plug-in solar panels
For plug-in solar panels facing south, east or west, our modelling suggests a realistic saving is often around £95 to £155 a year. The exact figure depends on the panel angle, the direction they face, and how much solar electricity your home can use while it is being generated.
- If you are usually out during weekdays, savings can still be around £95 to £115 a year. You do not need to be at home all day to benefit, because the panels can still help cover the baseload your home is already using.
- If you are home one or two weekdays, savings can rise to around £97 to £129 a year. Running an appliance while the panels are generating can help you use more of the solar electricity as it is produced.
- If you are home most weekdays, savings can reach around £100 to £155 a year. Being home more often gives you more chances to use spare solar electricity during the day.
- Balcony solar panels mounted upright can still save around £95 to £138 a year. East- or west-facing upright panels sit at the lower end, while south-facing upright panels sit higher in our modelling.
- South-facing panels usually give the strongest results, around £107 to £155 a year. That is because they tend to generate more electricity across the year.
- East- or west-facing panels can still save around £95 to £144 a year. They can work well, especially if your home uses more electricity in the morning or later afternoon.
These savings estimates exclude export income. Our plug-in solar export payments guide models how much 400W, 800W and 1,200W systems could export and what that electricity might be worth.
Upright east- or west-facing panels can use a high share of what they generate, because a 100W background load absorbs most of their output. But they generate much less electricity overall, so there is often not much spare solar left after the background load has been covered.
A south-facing tilted setup usually saves more because it generates much more electricity in the first place. The 100W background load still absorbs a useful share, but there is also more spare daytime solar available for things like laundry, dishwashing, charging devices or running other suitable appliances. That extra usable daytime electricity is what can push the annual saving higher.
UK savings for north-facing plug-in solar panels
North-facing plug-in solar panels usually deliver weaker savings than south, east or west-facing panels, so we do not include north-facing setups in our headline £95 to £155 typical savings range.
Upright north-facing panels are rarely a good choice because they receive very little direct sun. Almost-flat north-facing panels can perform better because they collect more light from the sky. Tilted north-facing panels can still produce some useful savings, but tilting the panels towards the north usually limits their direct sun exposure. If a south, east or west-facing position is available, that will usually be the stronger option.
If north is your only realistic placement option, plug-in solar may still be worth checking with a calculator. The key is to use cautious expectations and make sure the electricity generated is likely to be used in the home.
Seasonal plug-in solar savings in the UK
Annual savings are not spread evenly across the year. A saving of £120 a year does not mean you should expect to save about £10 every month.
As an example, a south-facing 800W kit tilted at 35°, with a 100W baseload and modest daytime use, might save roughly £123 a year. Split by season, that looks roughly like this:
| Season | Example saving |
|---|---|
| Spring | £36 |
| Summer | £41 |
| Autumn | £27 |
| Winter | £19 |
Notes on data
This seasonal example uses a modest daytime-use profile to show how savings can be spread across the year. It is illustrative, so it will not exactly match every rounded annual figure in the main savings table above.
Spring and summer usually do more of the work because generation is stronger and days are longer. Autumn and winter savings are lower, but they may still contribute, especially where a modest baseload uses most of the electricity the panels produce.
How long does plug-in solar take to pay for itself?
Annual savings are useful, but the kit only truly starts saving you money once those bill savings have covered what you paid for it. That break-even point is the payback period.
To estimate payback, divide the total price paid for the plug-in solar kit by the annual electricity saving.
The table below shows example payback periods for different kit prices, using low, middle and higher annual savings figures from the earlier average annual savings table.
| Example kit cost | If saving £95/year | If saving £125/year | If saving £155/year |
|---|---|---|---|
| £350 | 3.7 years | 2.8 years | 2.3 years |
| £450 | 4.7 years | 3.6 years | 2.9 years |
| £550 | 5.8 years | 4.4 years | 3.5 years |
Notes on data
These examples use an 800W plug-in solar kit with 2 x 400W panels and the annual saving range from the average annual savings table.
Simple payback is calculated as kit cost divided by annual saving. The examples do not include changes in electricity prices or gradual panel degradation.
Kit costs are illustrative. The real price should include the kit and any essential setup items needed for your home.
In plain English: for a typical 800W kit with 2 x 400W panels costing £450, a well-positioned plug-in solar setup could break even in roughly 3 to 5 years. Lower-cost kits can pay back sooner, while higher-cost kits need stronger annual savings to break even quickly.
How much could plug-in solar save over 5, 10 or 15 years?
Once the kit has paid for itself, the annual savings keep adding up. That is why the longer-term picture can be more useful than the first-year saving alone.
For this example, we use a £450 kit cost because we think that is a realistic retail price for a typical 800W plug-in solar kit with 2 x 400W panels. Cheaper or more expensive kits will change the payback point, but £450 gives a useful middle-ground example.
Using that kit cost and the annual savings range from above, the simple net saving could look like this:
| Annual saving | Time to break even | After 5 years | After 10 years | After 15 years |
|---|---|---|---|---|
| £95/year | 4.7 years | £25 | £500 | £975 |
| £125/year | 3.6 years | £175 | £800 | £1,425 |
| £155/year | 2.9 years | £325 | £1,100 | £1,875 |
Notes on data
Time to break even is calculated as the £450 kit cost divided by the annual saving. The net savings figures subtract the initial £450 kit cost.
The £450 kit cost is used as a realistic example retail price for a typical 800W plug-in solar kit with 2 x 400W panels. Actual prices vary depending on the kit, mounting equipment, cable length and any installation requirements.
They do not include changes in electricity prices or gradual panel degradation. The main Plug-in Solar Calculator includes a small annual allowance for typical panel degradation when estimating longer-term returns.
In plain English:
- A well-positioned plug-in solar kit will often pay for itself in roughly 3 to 5 years. After that, the annual bill savings become net savings.
- After 10 years, simple net savings could be around £500 to £1,100. That is after subtracting the initial £450 kit cost.
- After 15 years, simple net savings could reach around £975 to £1,875. The exact result depends on kit price, electricity prices, panel output and how much solar electricity the home uses.
That is why plug-in solar can offer a good medium- to long-term return on investment when the kit is well chosen and well positioned. Warranty terms vary, but as one example, EcoFlow's UK warranty policy lists 10-year warranties for its STREAM microinverter and 400W rigid solar panel. In practice, the panels may last longer than the warranty period: Energy Saving Trust says solar panels should last 25 years or more, although inverter lifespan and warranty terms should always be checked before buying.
The three factors that determine plug-in solar savings
Plug-in solar savings are shaped by three connected factors:
- Solar generation: how much electricity the panels produce.
- Always-on baseload: the background electricity your home is already using while the panels are generating.
- Spare solar use: how much extra daytime electricity you can use once the baseload has been covered.
Factor 1: How much electricity your panels generate
Solar generation sets the upper limit on savings. A plug-in solar kit cannot replace more grid electricity than it produces, so annual output is the first number to understand.
For an 800W plug-in solar kit facing south at an optimum 35° tilted angle, our UK postcode modelling puts typical annual generation at roughly 760 to 800 kWh. At the same 35° angle, east or west-facing panels are closer to 610 to 625 kWh, while north-facing panels are closer to 415 to 425 kWh. The exact result still depends on location, shading, panel type and mounting position.
The timing of that generation matters too. South-facing panels usually produce most strongly around the middle of the day, while east-facing panels shift more generation into the morning and west-facing panels shift more into the afternoon. That can affect savings if it changes how much solar electricity your home can use as it is produced.
For a deeper breakdown, including postcode lookup tools and interactive direction and angle comparisons, see our guide to plug-in solar generation across the UK.
More generation does not automatically mean more savings. A lower-yield setup can sometimes perform well financially if the home uses a high share of the electricity at the time it is generated.
Factor 2: Your household's always-on baseload
What does baseload mean?
Your household baseload is the background electricity your home uses when no large appliance is deliberately running. It includes always-on devices, standby devices and appliances that cycle on and off, such as fridge-freezers.
Common contributors include:
- fridge-freezers;
- internet routers and network equipment;
- standby electronics such as TVs, consoles and smart speakers;
- heating controls, alarms, doorbells and security cameras;
- computers, pumps, aquariums or extra fridges and freezers left running.
How baseload affects plug-in solar savings
Baseload gives plug-in solar an immediate use in the home. During daylight hours, the panels can cover some or all of the electricity already being used by fridges, routers, standby devices and other background loads. If the panels are producing 100W and the home is already using 100W in the background, that solar electricity can replace grid electricity without any change in routine.
In lower-generation setups, such as upright east- or west-facing panels, a 100W baseload can often use around 90% or more of the annual electricity generated by an 800W kit. That helps explain why balcony solar panels can still produce useful savings in a quiet home.
In higher-generation setups, such as south-facing panels tilted at 35°, the same 100W baseload typically uses around 50% to 65% of annual generation. That still contributes meaningfully to savings, while leaving more spare solar for appliances, timers and other daytime use.
With a modest 100W baseload and no extra deliberate daytime appliance use, our modelling suggests an 800W plug-in solar kit could still save roughly £95 to £115 a year. Using more spare daytime solar can push the saving higher.
How to measure your household baseload
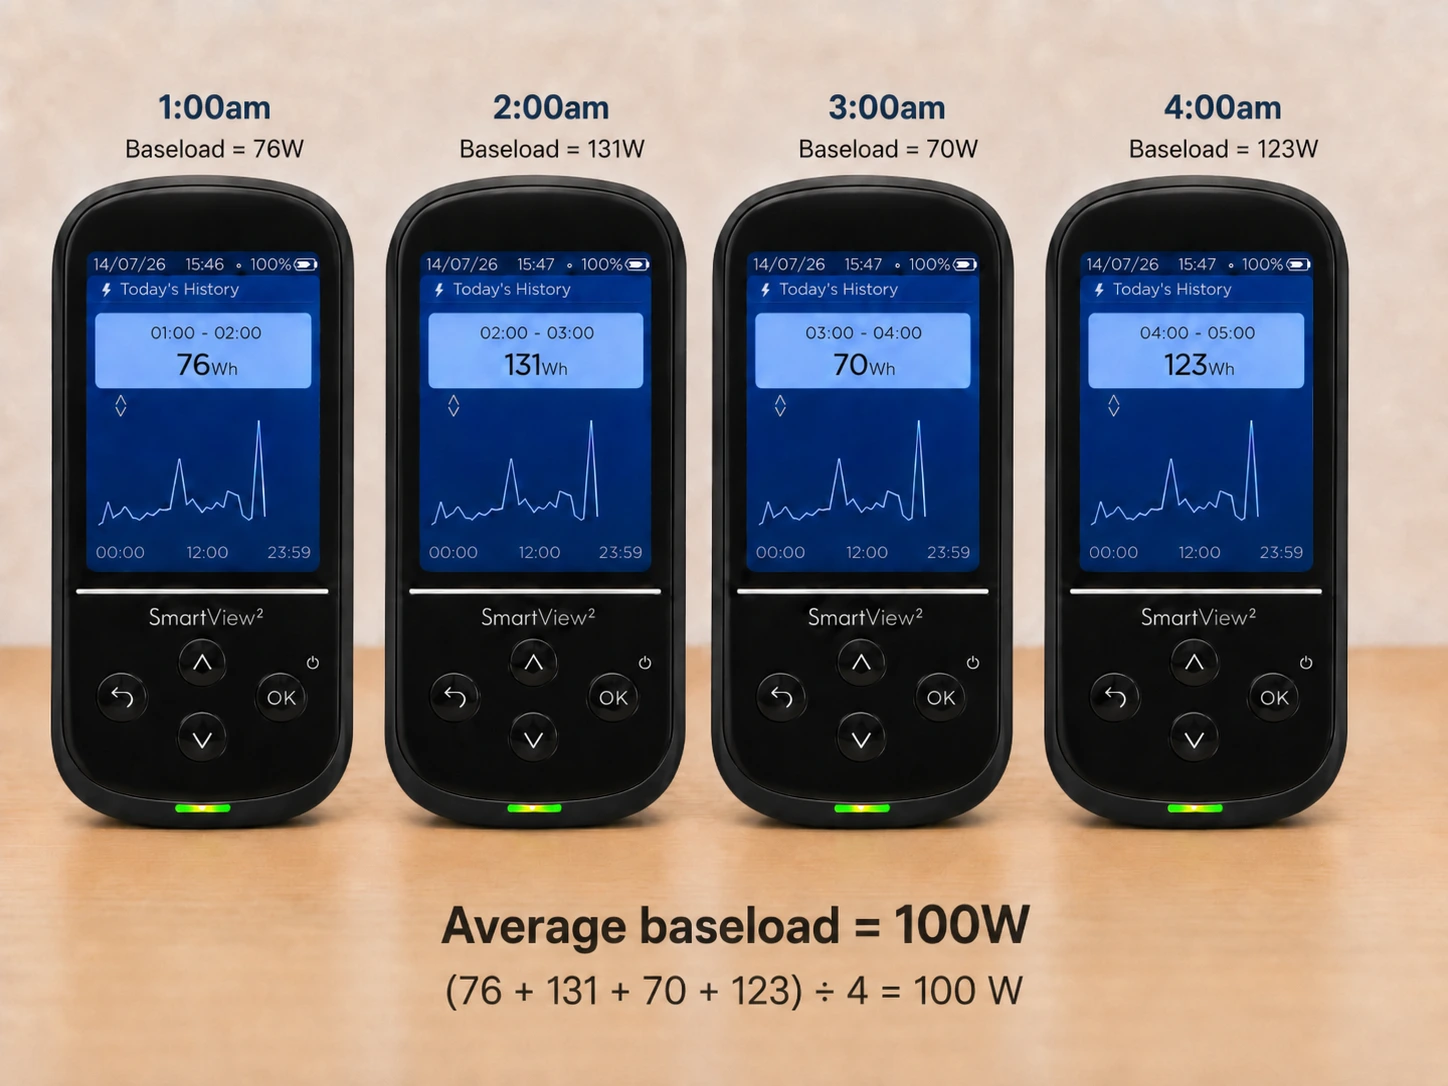
Knowing your own baseload makes plug-in solar savings estimates more accurate, and it is usually easy to measure if you have a smart meter.
1. Use smart meter or energy app readings
If your smart meter display, supplier app or energy app shows historic hourly use, check quiet overnight readings when everyone is asleep and no large appliances are running. If you only have a live demand reading, choose quiet periods during the day when no large appliances, TVs, desktop computers or other obvious loads are running. Watch the reading for a few minutes, repeat the check at different times, and average several typical readings rather than relying on one number.
2. Use a smart plug or energy-monitoring device
Smart plugs with energy monitoring can show how much individual plug-in devices use, such as routers, computers, freezers or entertainment equipment. They will not measure hard-wired appliances or the whole home, but they can help identify which always-on devices contribute most to your baseload.
3. Make a rough manual estimate
If you do not have useful meter data, list the devices normally left on and add typical wattages from labels, manuals or manufacturer information. Treat this as a rough estimate because labels often show maximum power rather than average use.
As a very rough sense check, your baseload might look something like this:
- Low baseload, around 70W: fridge-freezer 50W, WiFi router 10W, TV/console/smart speaker standby 10W.
- Moderate baseload, around 100W: fridge-freezer 50W, WiFi router and broadband/mesh equipment 25W, TV/console/smart speaker standby 10W, alarm, doorbell, security camera or digital displays 15W.
- Higher baseload, around 200W: fridge-freezer 50W, WiFi router and broadband/mesh equipment 25W, TV/console/smart speaker standby 10W, alarm, doorbell, security camera or digital displays 15W, extra freezer 50W, desktop PC or home server left on 50W.
These are illustrative averages, not fixed appliance ratings. Real devices vary.
Factor 3: Using spare solar electricity when it is available
What is spare solar electricity?
Spare solar electricity is the power being generated above your home's current demand.
For example:
- Solar generation: 600W
- Household baseload: 120W
- Spare solar electricity: 480W
If you then switch on a 60W laptop and a 300W dehumidifier, both could be powered by the spare output, leaving around 120W available for another load.
In reality, solar output and household demand change constantly, so this is a useful illustration rather than a precise allocation.
When is spare solar electricity available?
Spare solar is available when your panels are generating more electricity than your home is already using. In practice, that usually means solar output has risen above your baseload, leaving some generation available for other appliances.
- South-facing plug-in solar panels are most likely to have useful spare solar around the middle of the day, typically from about 11am to 2pm.
- East-facing plug-in solar panels are more likely to create spare solar in the morning, often around 9am to 12pm.
- West-facing plug-in solar panels are more likely to create spare solar later in the day, often around 1pm to 4pm.
- North-facing panels and some upright balcony solar setups are less likely to produce much spare solar, because more of their generation may be used by the baseload.
Clear, bright days are more likely to create spare solar. In winter, spare solar will usually be much more limited in all setups because generation is lower and the useful daylight window is shorter.
How using spare solar power increases savings
Once your baseload has been covered, any spare solar electricity is only valuable if the home can use it. A household that regularly uses some of that spare output during the day will usually save more than a household that lets it go unused.
The appliance does not need to be fully powered by solar. If 500W of spare solar is available and a device is drawing 700W, the solar output can still cover 500W of that demand, reducing the amount taken from the grid.
Which household tasks can use spare solar?
Good candidates are tasks that can happen during stronger generation periods without disrupting the household. This might include working from home on a laptop, charging devices, running a dehumidifier, using a slow cooker, doing laundry, running the dishwasher, vacuuming, mowing the lawn or using garden equipment.
Longer, moderate loads are often easier to match than short high-power spikes. A laptop, dehumidifier or slow cooker can absorb useful solar generation over time. A kettle may still benefit from spare solar, but only for the few minutes it is running.
Washing machines and dishwashers can also make useful use of plug-in solar. Their heating elements may briefly draw far more than an 800W system can provide, but other stages of the cycle use much less. Delay-start functions make it easier to run them during stronger generation.
Use one flexible load at a time
It is usually better to stagger flexible loads rather than run several large appliances at once. If 500W of spare solar is available, one appliance drawing 400W can use most of it. Two appliances drawing 1,500W each would still take most of their combined power from the grid.
Use built-in timers or manufacturer-approved controls where available.
How to increase your plug-in solar savings
The sections above explain where the savings come from. In practice, the best results usually come from a few simple choices before and after installation.
- Choose the sunniest safe position. Avoid regular shade and use the best practical direction and angle available.
- Understand your normal baseload. Measuring your background use helps you judge how much solar your home is likely to absorb automatically, and how much spare solar may be available for other devices.
- Use spare solar deliberately. Timers, delay-start functions and simple routine changes can help shift suitable tasks into stronger generation periods.
- Stagger larger loads. Running one flexible appliance at a time usually makes better use of spare solar than starting several high-power appliances together.
- Choose a kit size that matches likely daytime demand. A single-panel plug-in solar kit can suit lower electricity demand or homes with limited space, while two-panel plug-in solar kits provide more panel capacity. High-power plug-in solar kits can increase generation further, but extra panel capacity may not improve returns if the home cannot use much of the additional electricity.
- Count the full setup cost before buying. Brackets, longer cables, ballast and accessories all affect payback.
Choose carefully, then let the kit do its job
The strongest long-term returns usually come from choosing the right system once, setting it up well, and avoiding unnecessary upgrade churn. Replacing working panels for a tiny efficiency gain, swapping a suitable microinverter for a slightly newer model, or adding extras that do not materially improve performance can all push back the point where the kit has paid for itself.
It is usually better to take your time before buying: choose a kit that matches your space and daytime electricity use, check what is included in the price, look for a decent warranty, and make sure the panels can be positioned safely in a sunny spot. Once the system is set up well, the ideal outcome is fairly boring: it quietly offsets useful daytime electricity year after year without needing constant upgrades.
Use less power where it is genuinely wasted
Plug-in solar can reduce the electricity you buy from the grid, but it is still worth cutting wasteful use first. If a device does not need to be on, using less electricity is usually better than trying to cover that wasted demand with solar.
Simple habits can help: shut down a desktop PC or laptop rather than leaving it asleep for long periods, switch off unused screens or games consoles, and use appliance eco settings where they make sense. The aim is not to make your home uncomfortable or inconvenient. It is to avoid paying for electricity that is doing very little useful work.
This can stack with plug-in solar. Lower waste reduces your bill directly, while the solar kit can then cover more of the useful daytime electricity your home still needs.
The practical takeaway
For a well-positioned 800W plug-in solar kit, realistic savings can be meaningful without expecting the system to power the whole home. The strongest results usually come from a sensible kit price, good panel placement, a useful household baseload and simple daytime habits that help use spare solar when it is available. Choose carefully, avoid unnecessary upgrades, and the kit can quietly reduce your electricity bills for years after it has paid for itself.
Estimate plug-in solar savings for your home
Use your postcode, kit size, panel direction, angle, electricity rate, household baseload and expected self-use to estimate annual generation, bill savings and payback.
Try the Plug-in Solar CalculatorSources and methodology
Methodology
The government savings figures in this guide come from the Department for Energy Security and Net Zero's June 2026 analytical annex. Its examples use an 800W system, average UK solar conditions, a household occupied during weekdays, no or very little shading, no battery storage and savings based on electricity used directly in the home.
The Plugin Solar Calculator comparisons in this guide use European Commission PVGIS solar data by UK postcode area and apply a 15% deduction to keep generation estimates conservative. The modelled savings scenarios use the assumptions listed in the Notes on data dropdowns beneath the tables. For the full calculator approach, see our methodology and assumptions page.
The appliance and baseload wattages are broad indicative ranges based on common current product ratings. Real power draw varies by model and can change during operation, particularly for appliances with heating elements, motors or compressors. Check the appliance label, manual or a suitable energy monitor for a more accurate figure.
Sources
- Department for Energy Security and Net Zero plug-in solar analytical annex for indicative kit costs, self-consumption assumptions and annual savings examples.
- UK government plug-in solar consultation document for the policy context and proposed UK product framework.
- Ofgem electricity price cap unit rates and standing charges for the electricity rate used when this guide’s savings modelling was produced.
- UK government smart meter guide for information on near-real-time electricity-use displays.
- Energy Saving Trust home appliance guidance for background on appliance energy use, energy labels and efficient operation.
- Energy Saving Trust solar panels guide for solar panel lifespan and inverter replacement guidance.
- EcoFlow UK warranty policy for example plug-in solar product warranty terms, including STREAM microinverter and rigid solar panel warranties.
- European Commission PVGIS solar data for the postcode-area generation modelling used by the calculator.
Update history
- 1 October 2026: Clarified that the savings figures use the 26.11p/kWh Ofgem price-cap rate that applied when the modelling was produced.
- 29 August 2026: Added guidance on potential export income and linked to the dedicated export payments guide.
- 24 July 2026: Moved the key takeaways higher in the guide and added a clearer closing summary of the main savings, payback and usage points.